One Hundred People .org
The world is too vast and complicated for our poor brains to process. We evolved in small villages and can only really cope with about 100 social connections. But what if we could visualise our country as if it was a village, with one hundred people in it... what would that look like?This website takes all of the UK's 68m people, and scales them down to a village with one hundred people - the idea is to get the 'big picture' (so we'll mostly be rounding to the nearest whole person).Let's have a look at the village...
Who lives in our village?
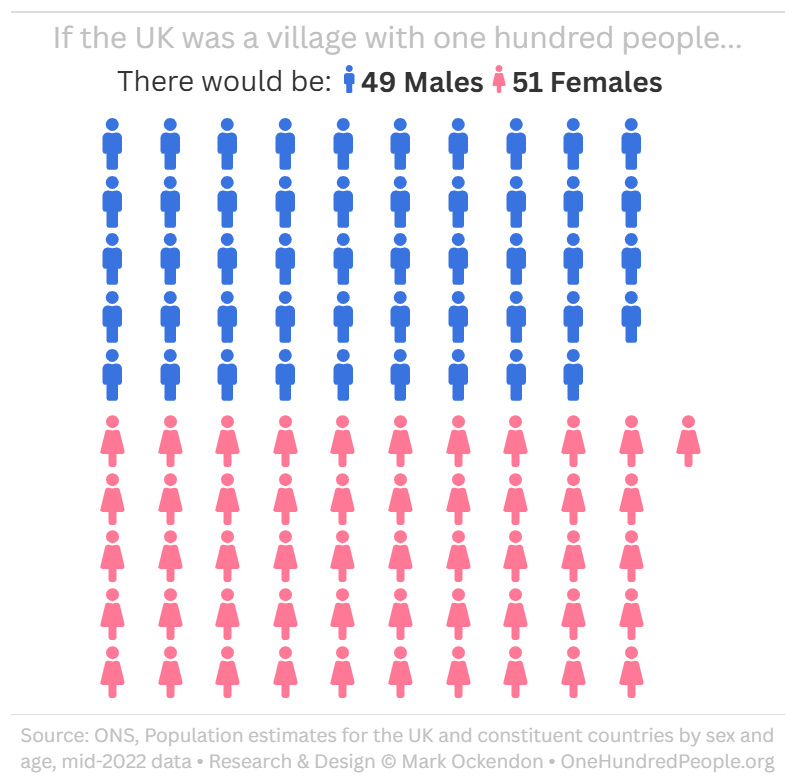
There are slightly more females because they live slightly longer on average.
How old are the villagers?
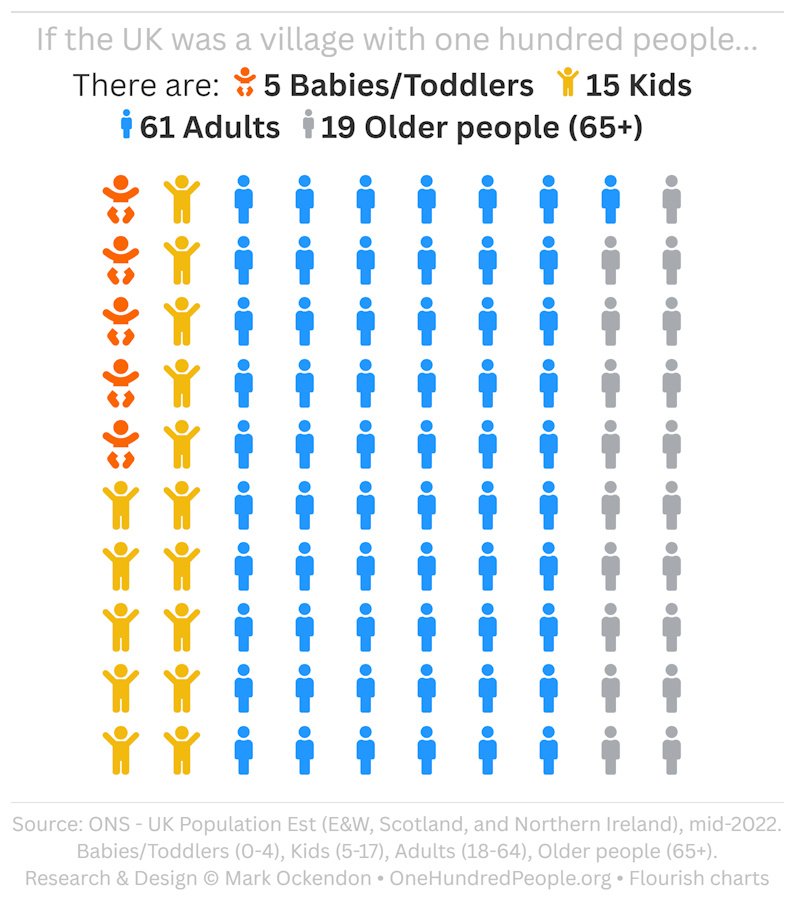
Our village has changed a bit since our parents or grandparents were young.Back in 1971 the village only had 82 people in it, rather than 100 now.There are slightly fewer kids (23 → 20 now) but the big difference is the number of adults has grown (48 → 61) and there are almost twice as many older people aged 65+ (11 → 19).
What is their heritage?
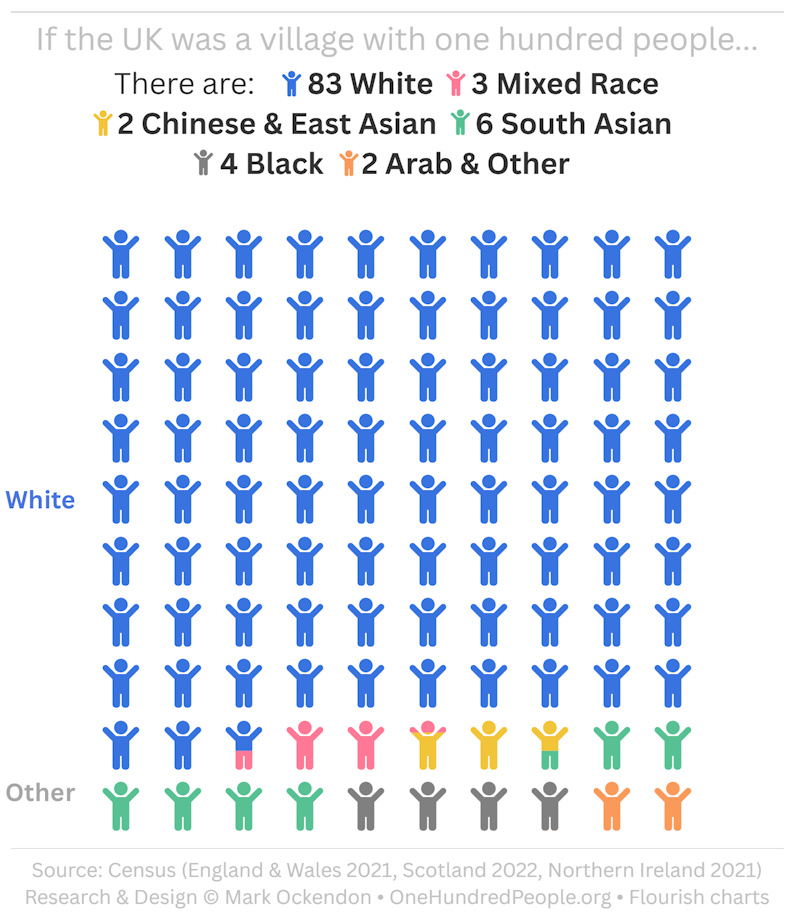
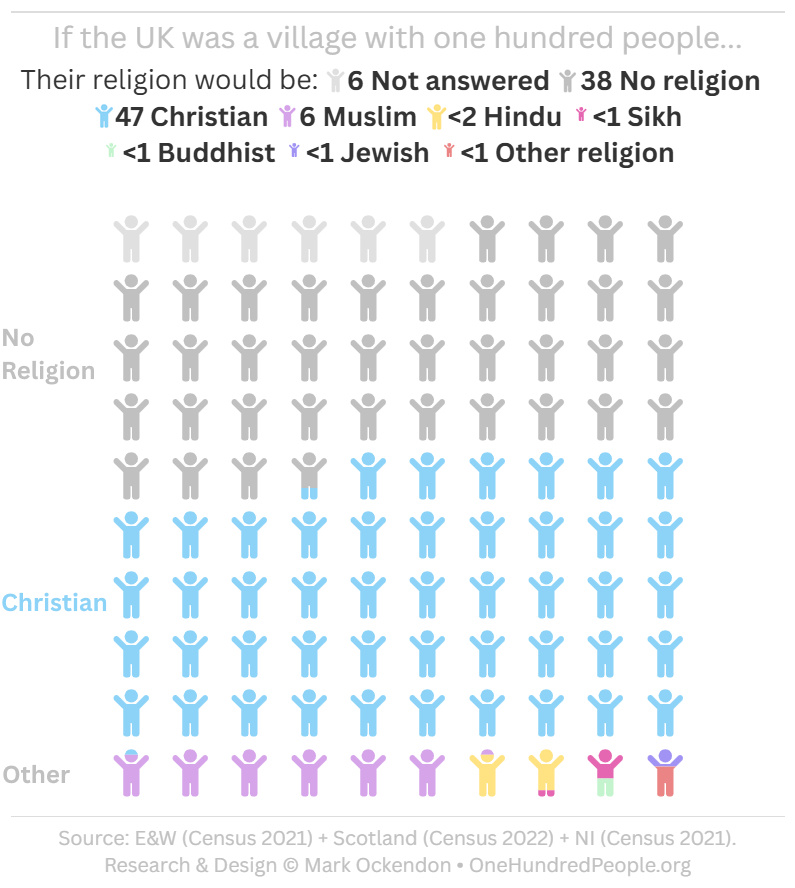
What do they believe?
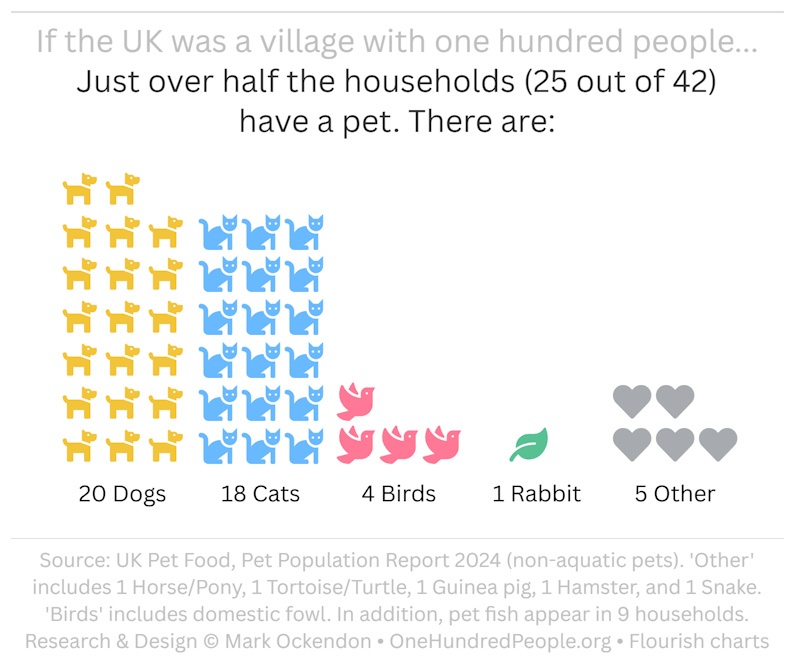
How many pets?
Who visits the village?
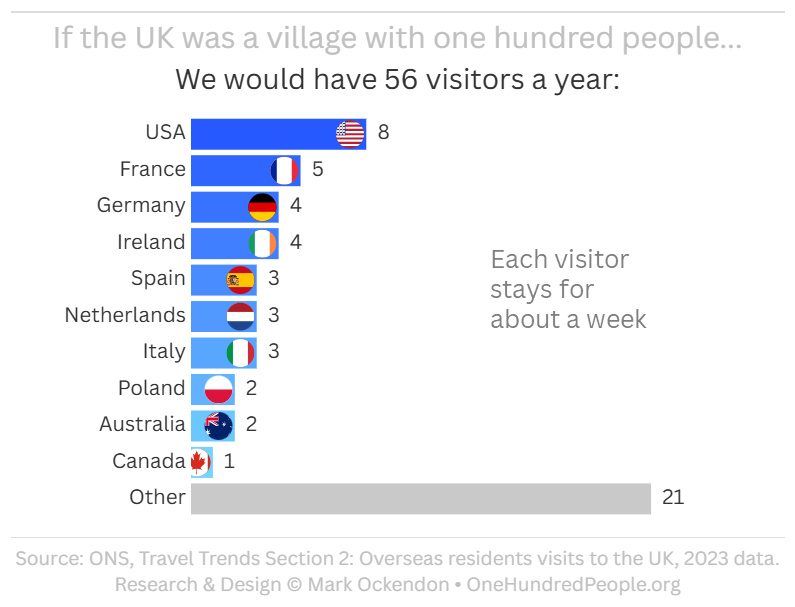
We do get visitors (tourists) to the village! We see a new person roughly every week. And on average they stay for a week, so there's always one tourist here at any time.They visit from all over the world:
Houses
Where do the villagers live?
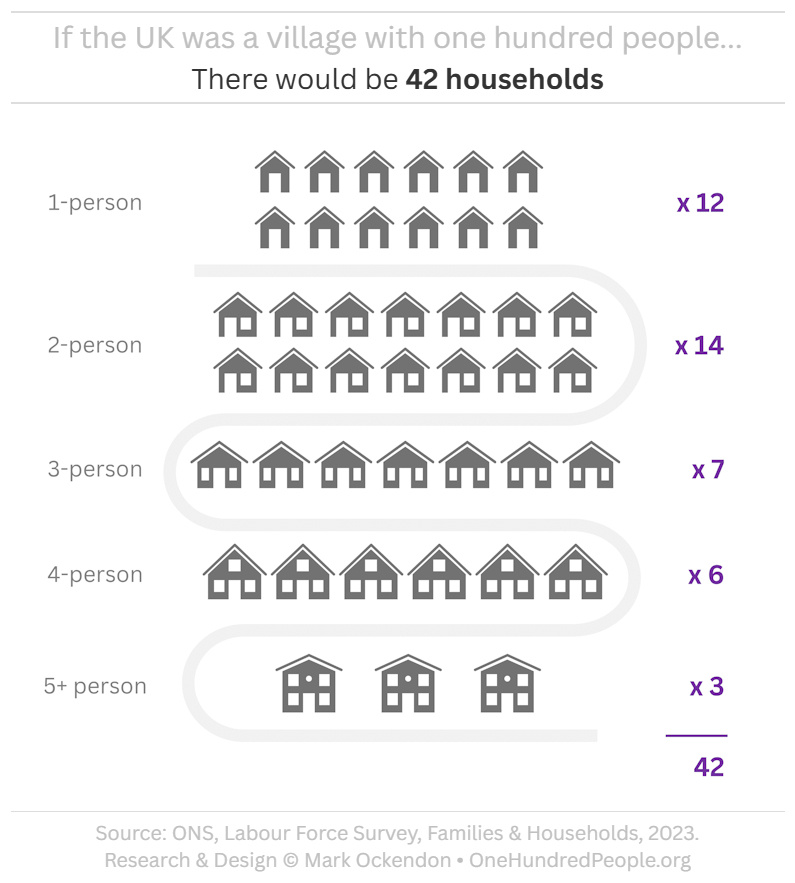
There are currently 42 houses in the village for our 100 people, with a mix of sizes. Here they are:
Who owns and who rents?
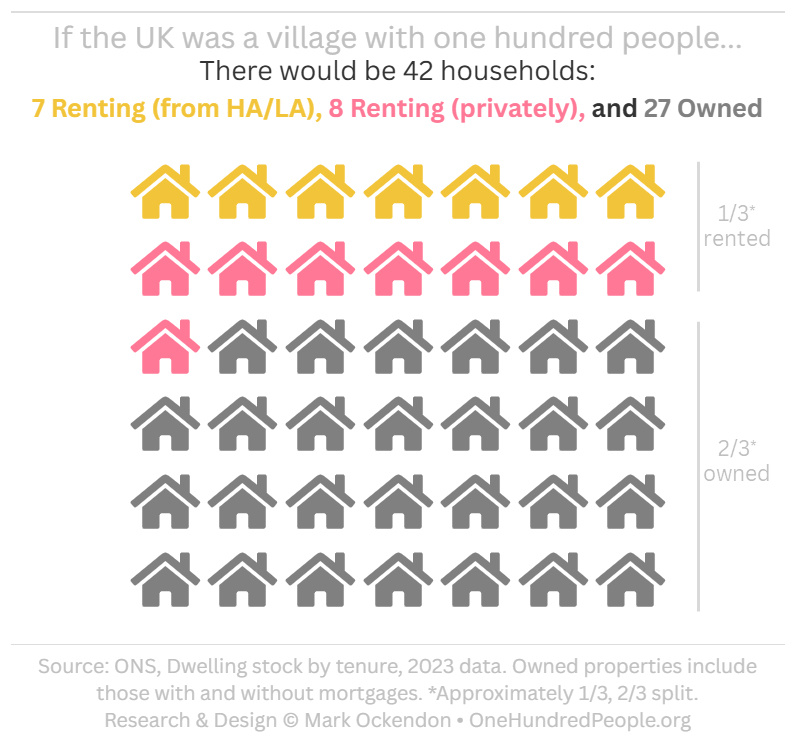
About 1/3 are rented, and 2/3 owned (with or without a mortgage).Over the last 30 years we've built 7 new houses: one because people now prefer to live in slightly smaller households, and the other 6 for the extra adults and pensioners living in the village.
Ever wonder what all those people are doing?
Next:
Employment
What are the villagers up to? How many of them are officially working, and what do the rest do?
How many are working?
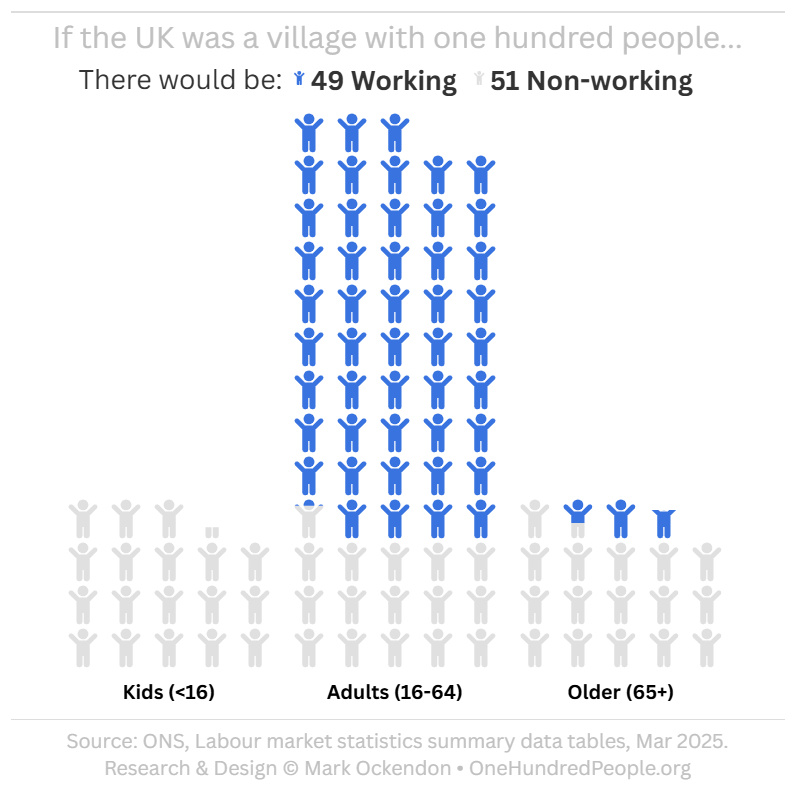
Broadly half (49) of the villagers are working. The rest are mostly kids and older / retired people.
What are the working people doing?
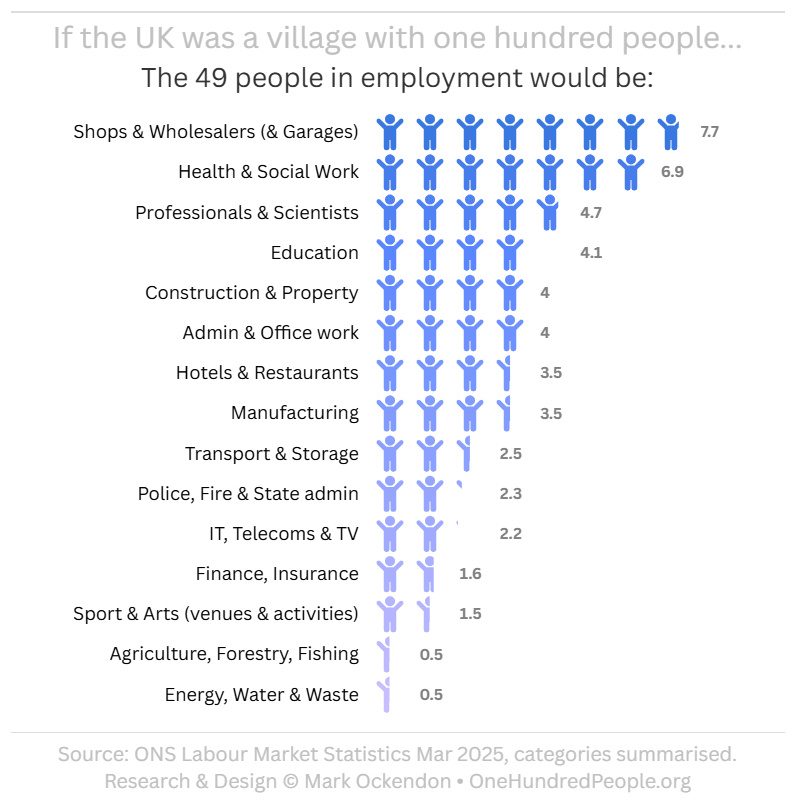
There are:
• 9 working directly in the public sector, and
• 40 in the private sector (34 employed / 6 self-employed).
How many hours are they actually working?
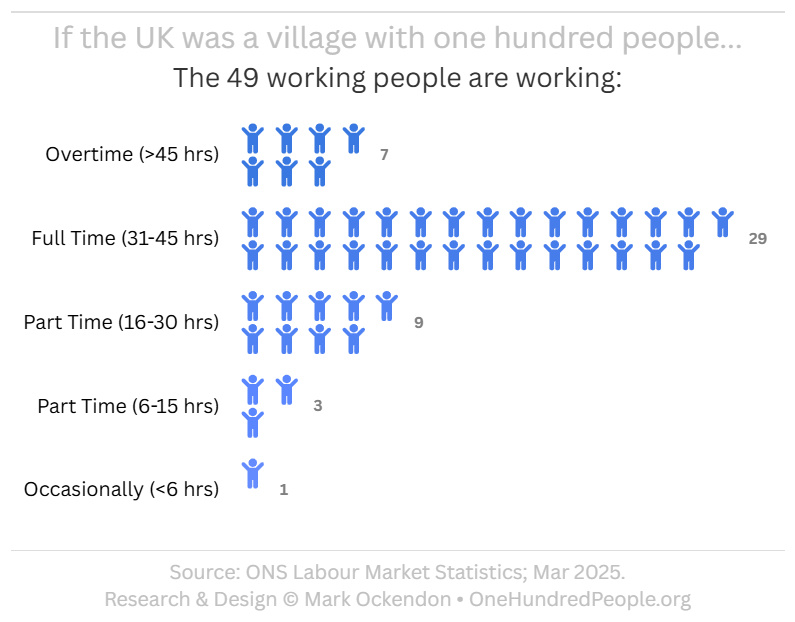
How many are not working?
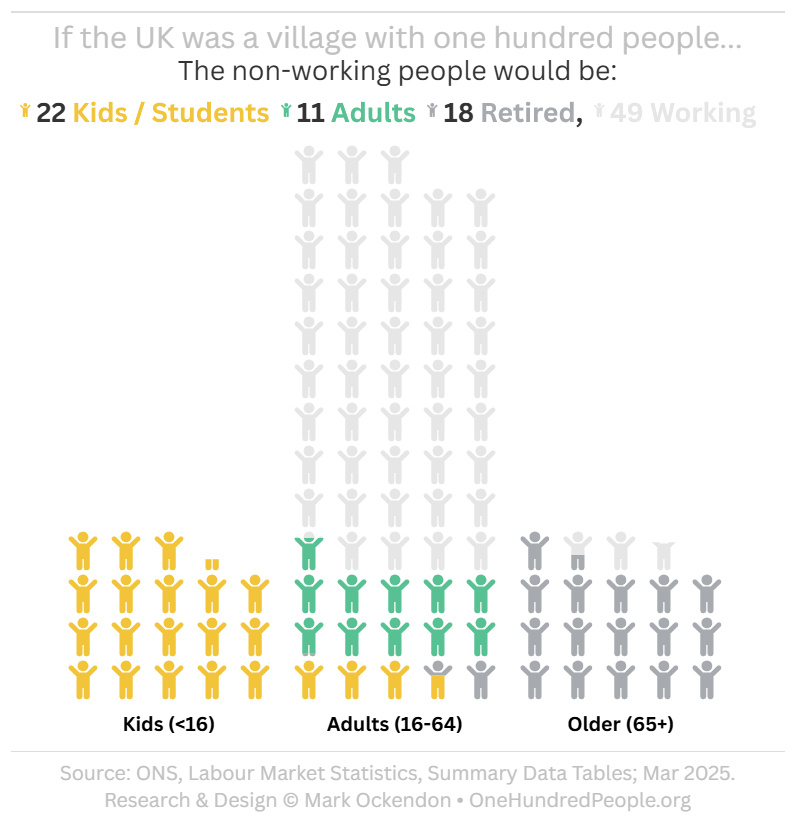
There are 22 kids and adult students. 11 Adults are officially non-working (more info below). And 18 people have stopped working and are retired.
What are the non-working adults doing?
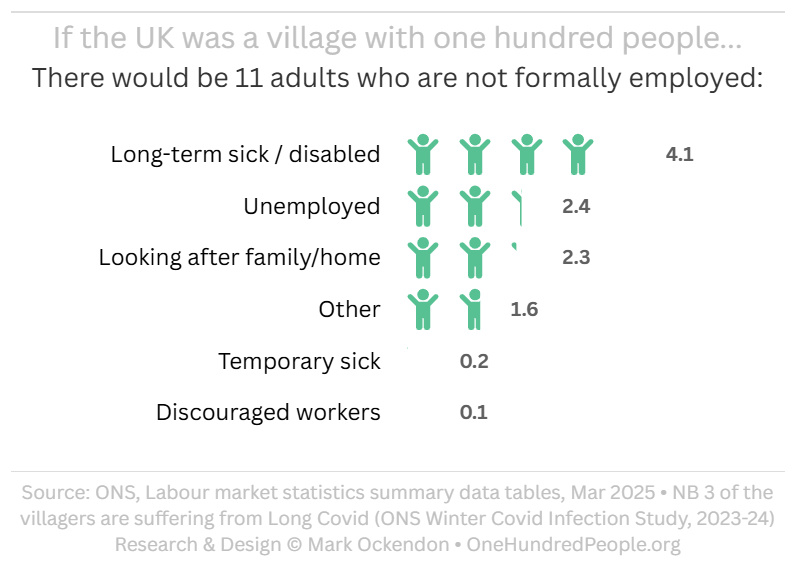
3 of the villagers are suffering long-term effects from Long Covid.
Earnings
How much do the villagers earn?
This isn't quite as easy to answer as you might think. As well as income from their jobs, some have self-employment income, and others have investments (rent, savings, and dividend income).The easiest way to see how much our villagers earn is from tax returns:
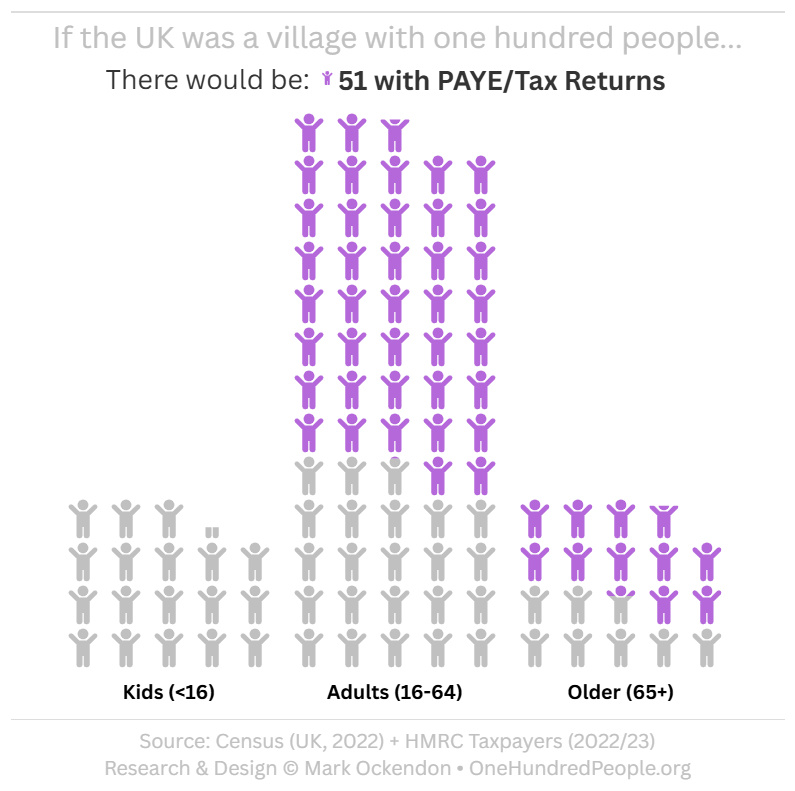
See the (references) page for more detailed notes on this graph.
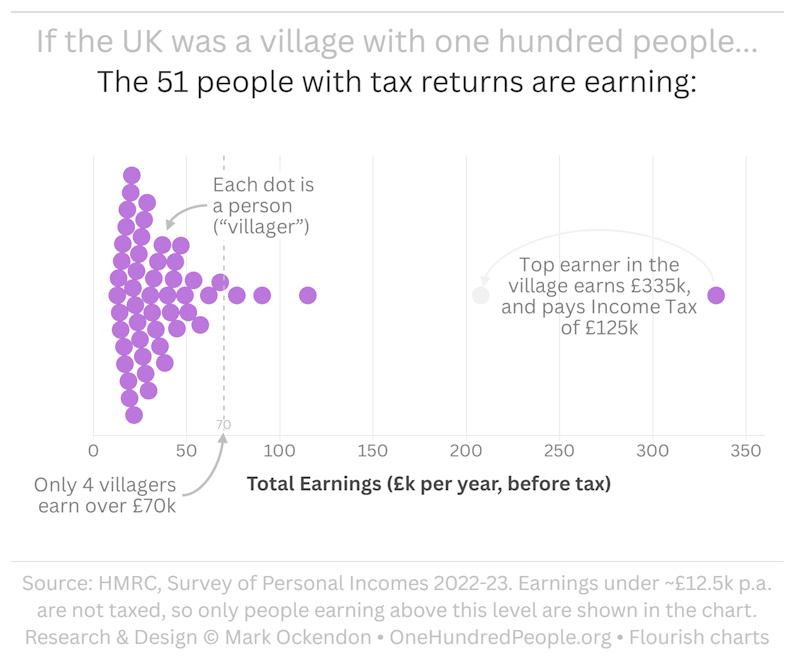
A typical villager ("median") earned £28,400 in 2022/23. This means that half of the villagers have total income above, and half below this level.The top earner in the village makes £335k on average, but pays a lot of taxes as we'll come on to see...
Other Buildings
Where do the villagers work?
As well as the houses, there are 3 other buildings for business and leisure. Most of the floor space is used as a factory, warehouse, shops, and offices.

Next:
Government
£millions, £billions... governments love a press release with big numbers in it... but these numbers are so large and usually without context that they become meaningless.So what's actually going on in our 'village' economy? Let's have a look...
As a quick reminder, the Mayor does two main things: 1) Writes down the laws and rules of the village, and 2) Organises contributions from the villagers towards the overall running of the village (Village Budget).Let's have a quick look at the village budget first because it gives us a good overview of what's going on.
Taxes
Most of the workers contribute a proportion of their income towards the running of the village ("taxes"), and those that produce more, generally contribute more.This goes into a common 'pot', which the Mayor distributes, so rather than everyone having to work in the farms & fields it frees up some people to be teachers or doctors or look after the kids. This has been going on for many years and keeps the villagers educated and healthy.
How much goes into the pot?
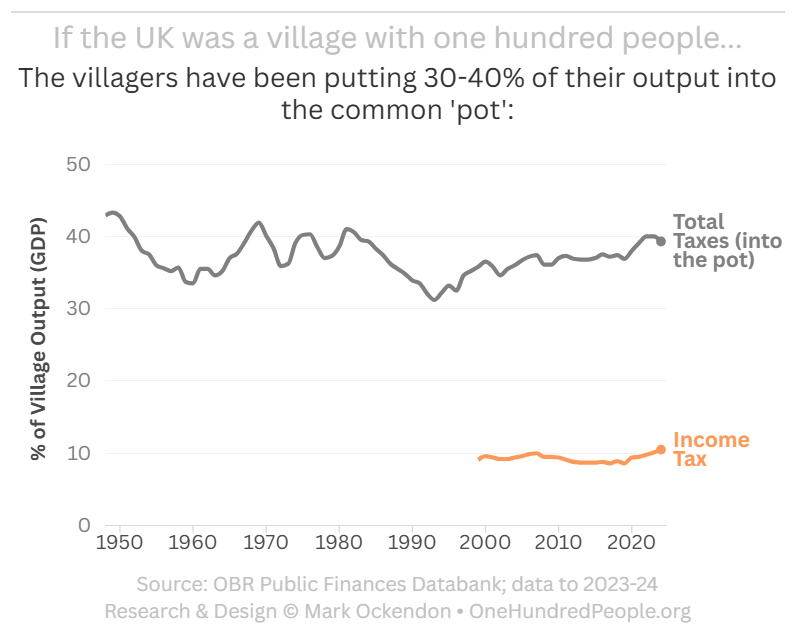
When most people think about tax the first thing that comes to mind is Income Tax. But there are lots of others such as National Insurance, VAT, Road Tax, Council Tax...Whilst the amount that goes into the pot varies a bit over time, it's currently about 40% of the total output of the village each year.
Village Budget
Here's an overview of all the taxes taken in, and where the Mayor distributes those resources.
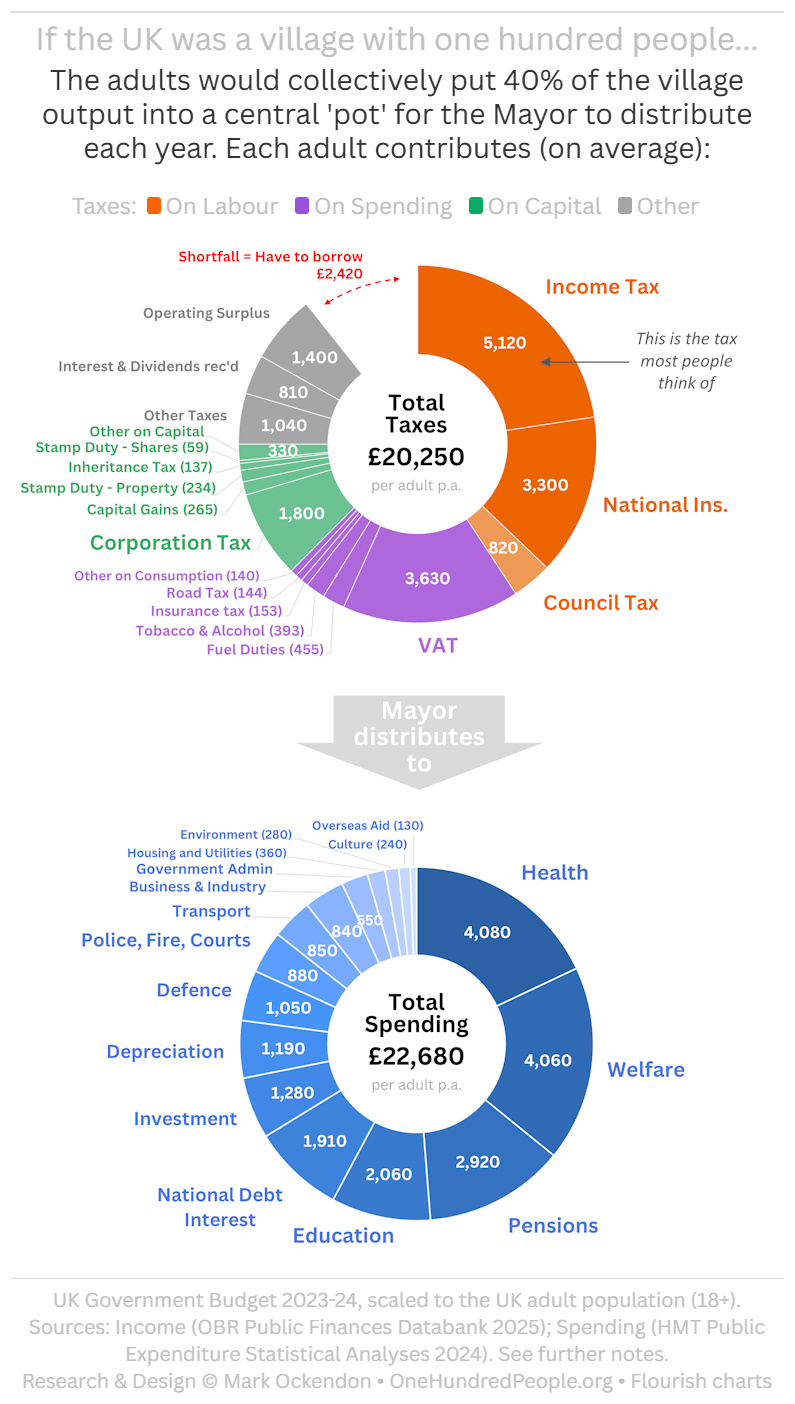
There's a lot going on in there! Take some time to read through it. Then let's have a look at some of the bigger items.
Taxes
Income Tax & NI
Income Tax and National Insurance are basically the same thing - a tax on wages - but the UK likes to make things complicated so they're accounted for separately and have their own specific rules. Together these are the biggest contribution to the pot.The UK has a progressive income tax, which means higher earners pay a higher % of their income in tax. Here's the impact on wages:
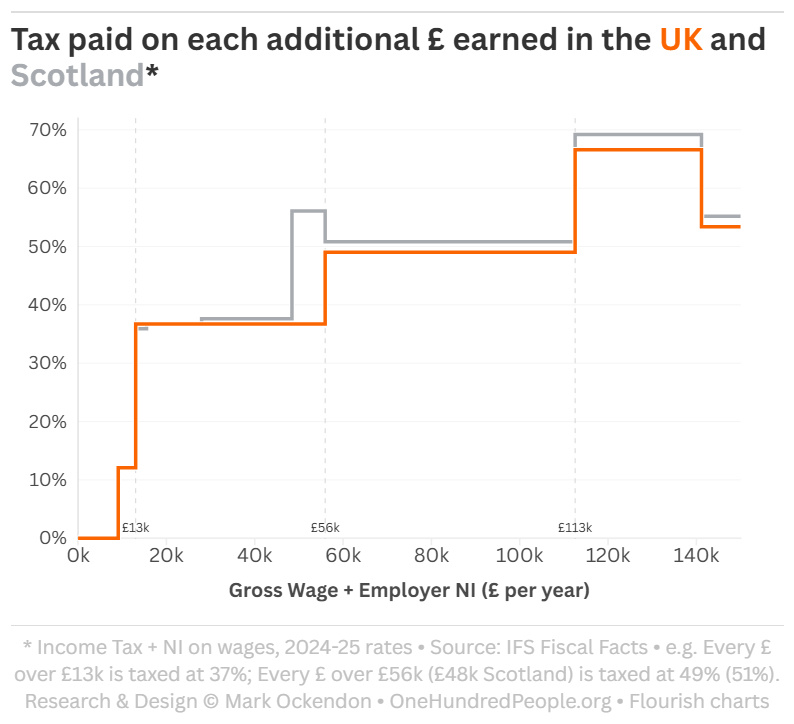
All three taxes - Income tax, Employee NI, Employer NI - are combined in the graph above. They are all taxes on your wage, it's just that some are more hidden than others. e.g. the "Employers NI" is usually just shown as a note at the bottom of your payslip. Self-employed people get a discount off these rates. See the (references) page for more detailed notes on this graph.
If you thought it was only higher earners that payed "40% tax" have a look... anyone who's employed pays 37% tax on every pound above £13k.When politicians talk about raising or lowering income tax, they're usually only focusing on one part in isolation (either Income Tax or National Insurance)... but both come off your wage.
Ok, so how much does each person pay? Well because you get the first £13k of earnings (mostly) tax-free, most people actually end up paying a fairly low rate on average.This chart takes all the villagers who pay income tax and lines them up in order:
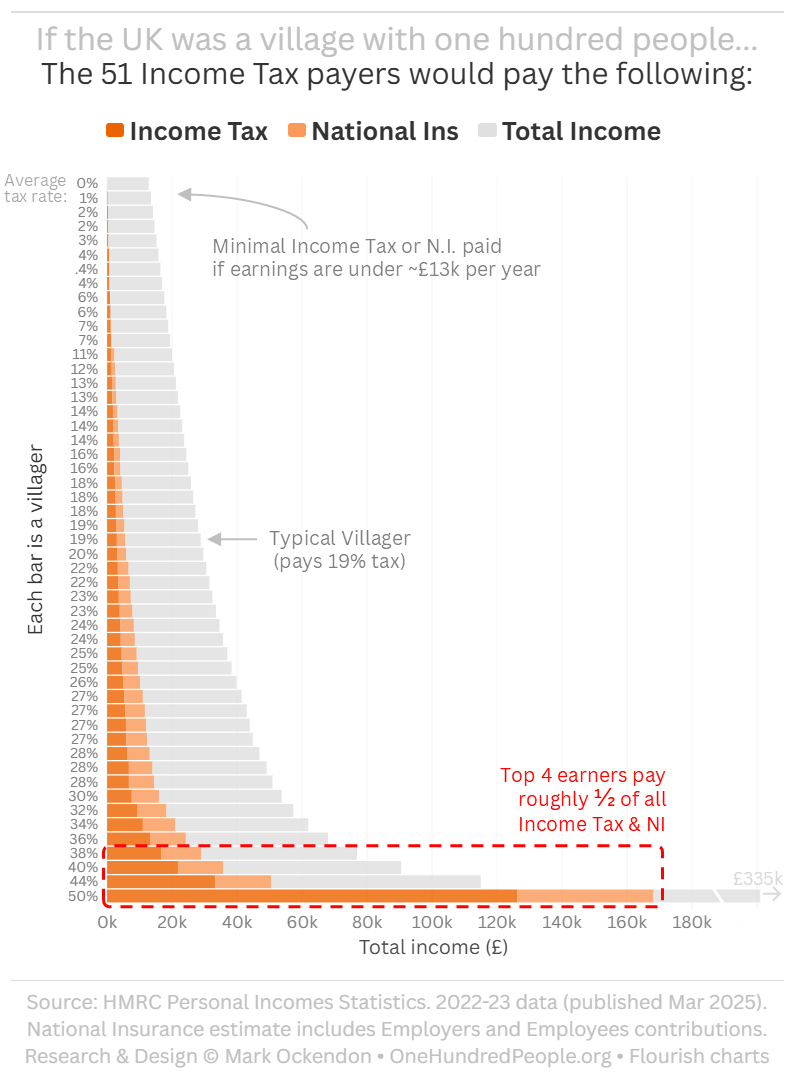
See the (references) page for more detailed notes on this graph.
The 4 top-earning villagers contribute about half of all Income Tax & NI raised, with the other 47 contributing the other half.
VAT
VAT is charged on most things you buy, so it's called a consumption tax. In the UK it's typically 20% and is already included in the price you see. There are some exceptions and generally 'essential' items are charged at a lower rate.This is the second largest tax after Income Tax & NI, contributing almost 1/5th of total taxes.
Corporation Tax
Companies pay tax too, about 1/10th of total taxes.But remember a 'company' is just a creation of our imagination - it doesn't physically exist. It's just a way for us to group people and assets together, and they only exist because we all collectively agree they exist.Companies are ultimately owned by individuals, either directly or in their pensions. As well as paying Corporation Tax, the individuals also pay Income Tax when they receive a share of profits from the company.
Spending
Ok enough about taxes, where does the pot get distributed?
(Coming soon...)
Debt
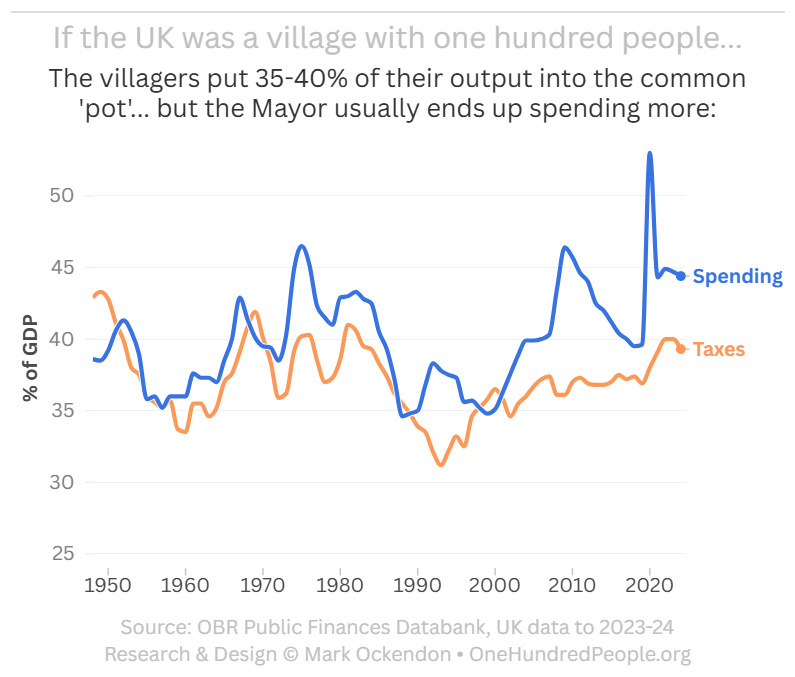
So it looks like the Mayor distributes more resources from the pot than actually goes in... how is that possible?Well the extra resources do come from the villagers, usually the wealthy ones who have some spare, in order to make up the spending.But the trick is that rather than calling these extra 'taxes', the Mayor says they're 'borrowed' resources, and promises that in future years the villagers will put extra resources into the pot to pay them back.This has been happening year after year. Some of it has been going into actual assets/investments, but much of it is just covering day-to-day spending. So the total debt has been gradually rising.
Wealth
If we're thinking about the wealth of the village, we're probably interested in who owns what. Looking at the big picture:
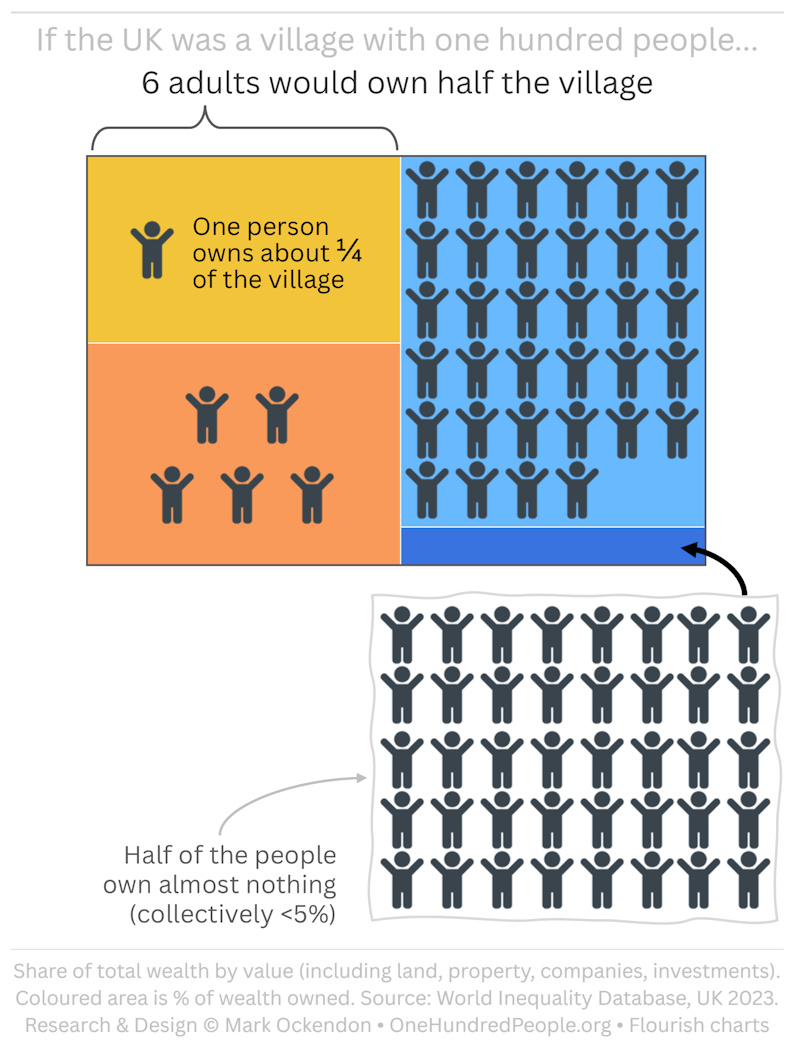
The wealthiest person owns about a quarter of the village. And the six wealthiest together own half the village.
How has this changed over time?
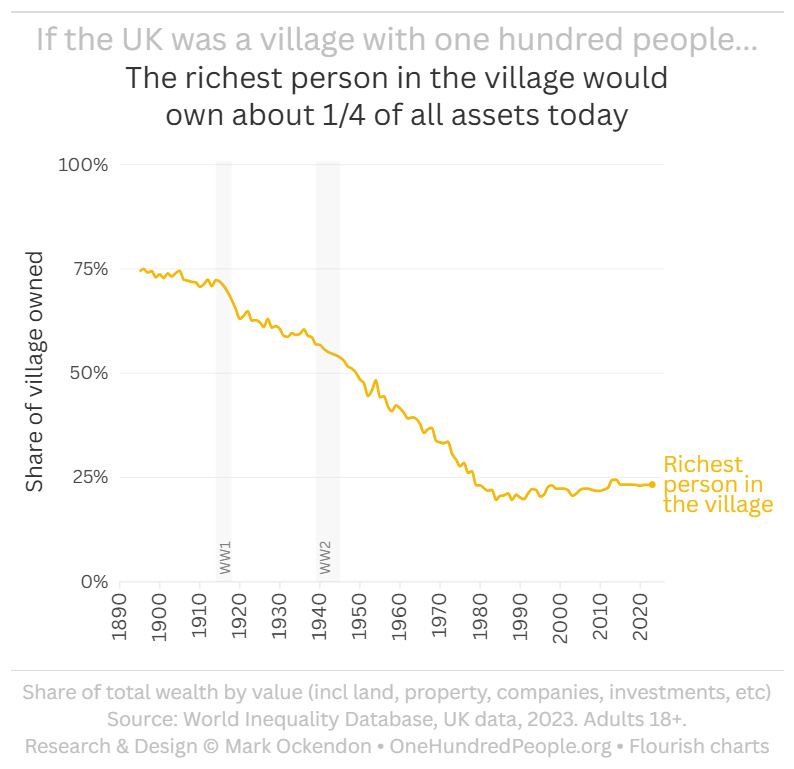
Believe it or not, the share of wealth owned by richest person has actually decreased significantly over time, from about 3/4 of the village (back in Victorian times) down to about 1/4 today. There are very few Downton Abbey lifestyles any more.But whether one person should own a quarter of the village today is still an open question...
What does an average person own?
If we arrange everyone in a row we can see that a typical person has around £74k of wealth (after they deduct their mortgage and any loans):
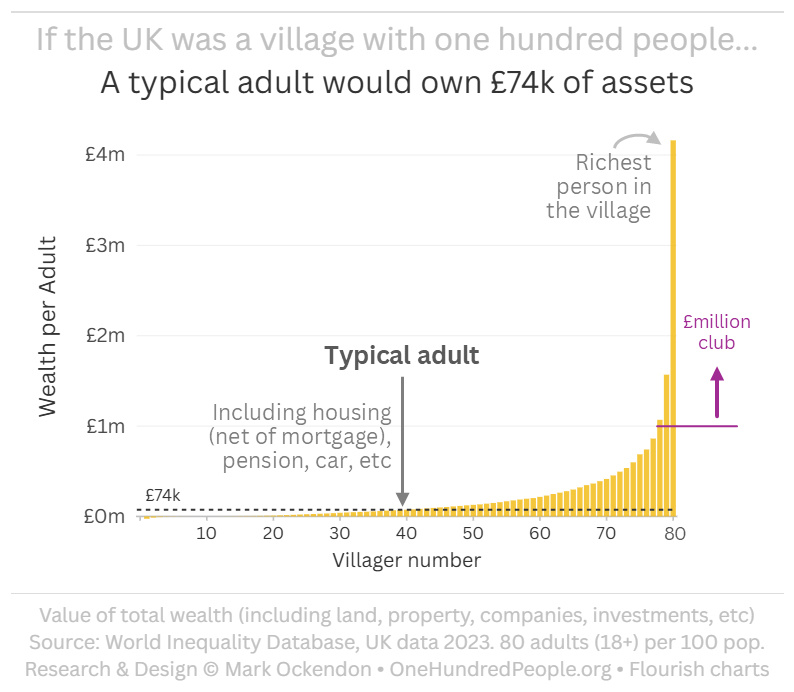
See the (references) page for more detailed notes on this graph.
Three make it into the £1m club, and we can also see the richest person there with their £4m+ of wealth.
Ok let's have a look at how the Mayor is running things in this village:
DRAFT - Wealth
Zooming out
Ok so that's our village.But... wealth is a strange thing... it becomes even more concentrated the higher up you go.We don't often look outside our village, but for a moment let's zoom out and look down at 100 villages (all still in the UK).What about the richest person now? What we find is that the richest one person across 100 villages actually owns more than three whole villages.Yep it's true.Three whole villages owned by one person!Most people don't really notice though because the assets are spread out across all the villages.
How has this changed over time?
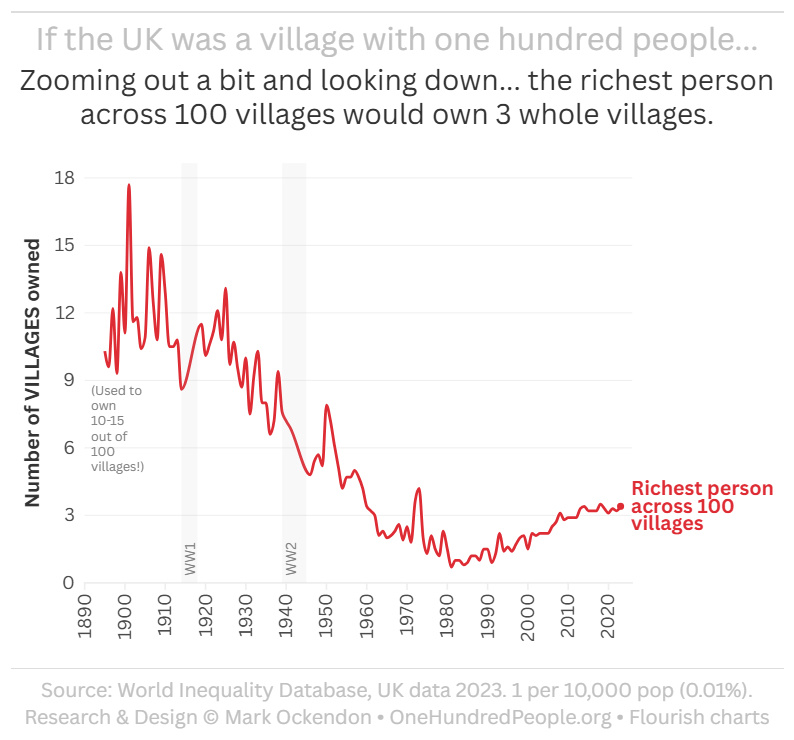
The richest person across 100 villages (0.01%) used to own 15 whole villages back at their peak in the 1900s!This fell to an all-time low of <1 in 1981 (how did they survive owning just one village...) but this has gradually crept back up to just over 3 now.
So:
- In one sense the wealth of the moderately rich (top 1 in 100) has been relatively stable over the last few decades, with one person consistently owning 1/4 of the village;
- But zooming out, the share going to the super wealthy (top 1 in 10,000) seems to be creeping up again since the 1980s.Regardless, let's not lose sight of the fact that half of the UK 'village' owns practically nothing.
There are two main types of asset:REAL Assets - are used to produce goods or services.They are usually physical (e.g. land, houses, buildings, equipment, inventories, natural resources) but can also be intangible (e.g. software, patents).FINANCIAL Assets & Liabilities - are a record of how labour or assets will be reallocated in future (e.g. cash, loans, shares).
Real Assets
Looking at all the assets in the village, the largest values are in land and buildings:
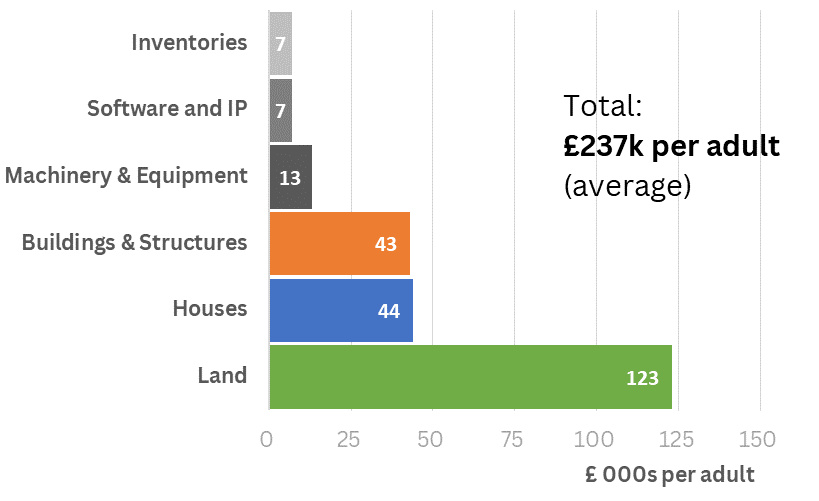
See the (references) page for a more detailed explanation.If we refer to 'assets' below, that is shorthand for real assets. Financial assets & liabilities will always be written in full.
Note: The land underneath a house/building is considered a separate asset. So the value of a house is split into 'house' and 'land' separately.
Discussion
This section is actively under construction and will develop over the next few weeks.
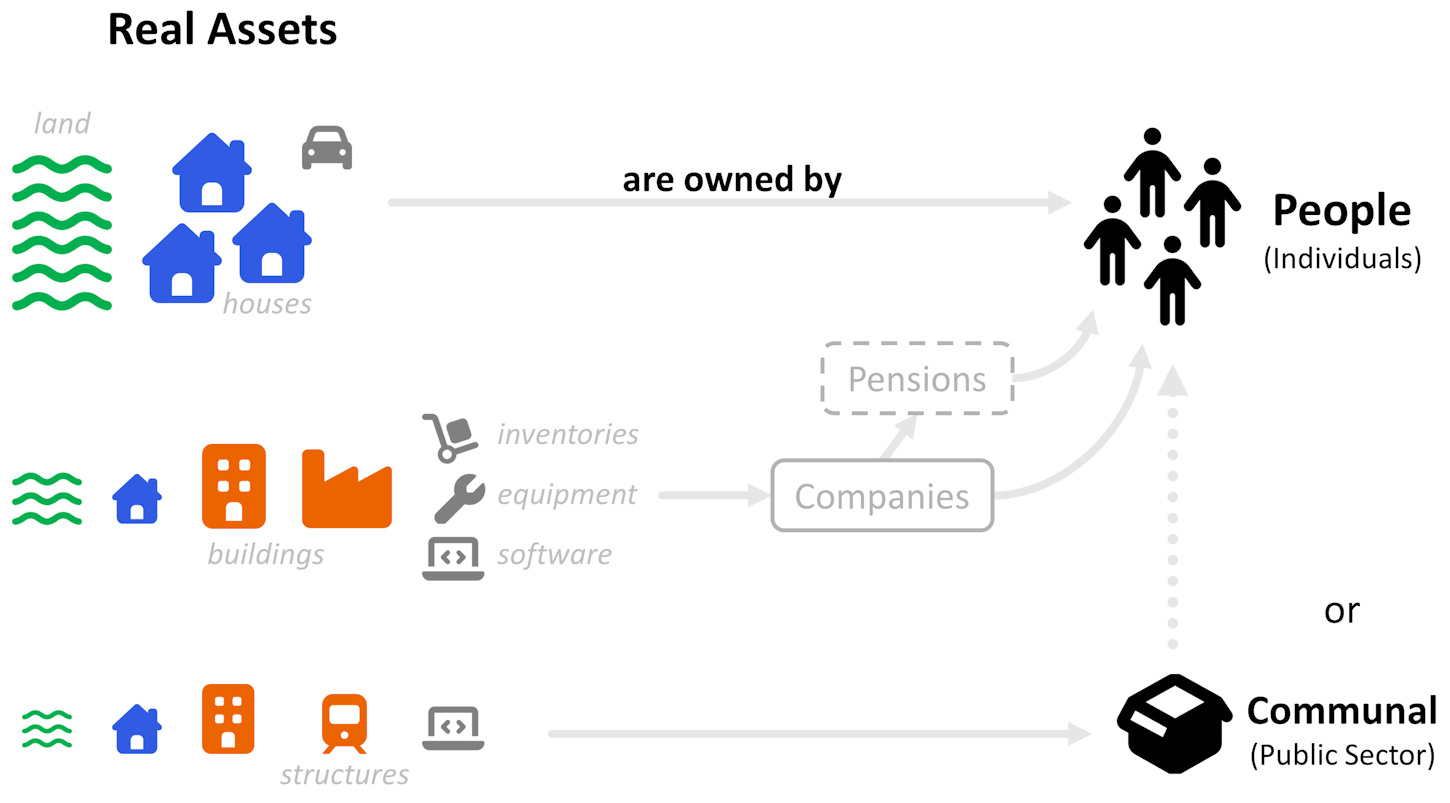
Remember that everything in the village is either owned by individuals (Privately), or owned collectively (Public Sector).Assets in the private sector are usually reported against either people or companies. But let's not forget that those assets are ultimately owned by people. Even if there's a limited company / pension / trust / partnership in the middle... somebody is ultimately the owner or beneficiary of those assets.
Page 4 - Wealth
Notes:
• Real Assets - who owns what just now;
• Financial Assets & Liabilities - who is due to pay/receive something in the future.Financial Assets & Liabilities:
Example 1: If a person works for a month they usually haven't received anything physical from their employer during that month. But they receive tokens (cash) - this represents transfers that are due in the future. Over the next few weeks, goods and services will be transferred to them, in exchange for tokens (cash).Example 2: If a person is a borrower they will: A) work in the future to transfer resources to the lender; or B) transfer assets to the lender to pay off the debt.One other point to note is that all financial assets & liabilities in our village net off to zero, as they do in all economies. This is because all debtors and creditors in the accounts are in balance.
About
This website is a project which aims to shed some light on how the world looks around us.Why do this project?1) Large numbers are hard to grasp, especially without context [so: Scale them down for perspective].2) People are generally more negative when they think about somewhere further away from them, than the same topic locally [so: Make things local and think as a village].3) Politicians and media owners are all trying to influence people with sound bites, shock tactics, and misdirection. Certain topics will always be emotive, but the facts are often missing [so: Present the facts in as clear and unbiased way as possible, attempt to provide an anchor for meaningful discussion].4) Trying to explain things in simple terms often highlights any shortfall in our understanding [so: Keep things simple, be open to questions, and continue to evolve our understanding].Standing back and having a sober look at the shape of our community will help us decide if it's set up in a way we agree with.
Ever since being inspired by the likes of Edward Tufte and Hans Rosling I've been trying to simplify, clarify, and find the story in the data. This site is a work-in-progress and I'm gradually adding new charts as I work through the datasets.If you have any feedback (encouragement or suggestions) feel free to email me at:info @ [website] dot orgCheers, Mark
Weird way of typing the email address is to try and avoid the spam bots, but I'm sure you can figure it out!Last updated Aug 2025
Notes & Referenes
There's a lot of serious statistics behind these charts, often with differing baselines and/or basis years. Core sources are referenced under each chart with some further info below.Principal sources:
ONS - Office for National Statistics
OBR - Office for Budget Responsibility
IFS - Institute for Fiscal Studies
HMT - His Majesty's Treasury ('The Treasury')
HMRC Revenue & CustomsChart software provided by the excellent Flourish team.
Page 1 - Home / Villagers
(To follow...)
Page 2 - Employment
LONG COVID: ONS report Apr 2024: (link)
EARNINGS: You might notice that the number of villagers with PAYE/Tax Returns (51 - in purple) is similar to the number of working people (49 - in blue) further up, but they're not exactly the same people: some of the working adults don't pay tax (if they earn less than about £12,500 per year), and some of the older people do pay tax (if they have large pensions or investments).
Page 3 - Wealth
WEALTH PER ADULT: The ONS are very transparent in reporting the quality and reliability of their statistics, some of which are better than others. In this case the ONS had previously reported median net wealth around £125k per adult in the UK. However the ONS data was based on a relatively small survey of people, and had some methodology changes in terms of valuing pensions which caused a significant downward revision subsequently. The data we have used is from the World Inequality Database which sources information directly from the UK National Balance Sheet, which should be more robust, so a number around £70k for a median (typical) adult is more realistic.
Page 4 - Government
INCOME TAX & NI: In the first pie chart ('Total Taxes') the average Income Tax is £5,120 and NI at £3,300 per adult, but remember that is an average. A typical villager in the middle of the INCOME TAX & NI chart pays something more like £3.0k of Income Tax + £2.5k of National Insurance, and the rest is made up by the higher earners. But the amount of Income Tax and NI paid by each individual very much depends on their specific mix of income. Also remember that 11 of these taxpayers are pensioners.